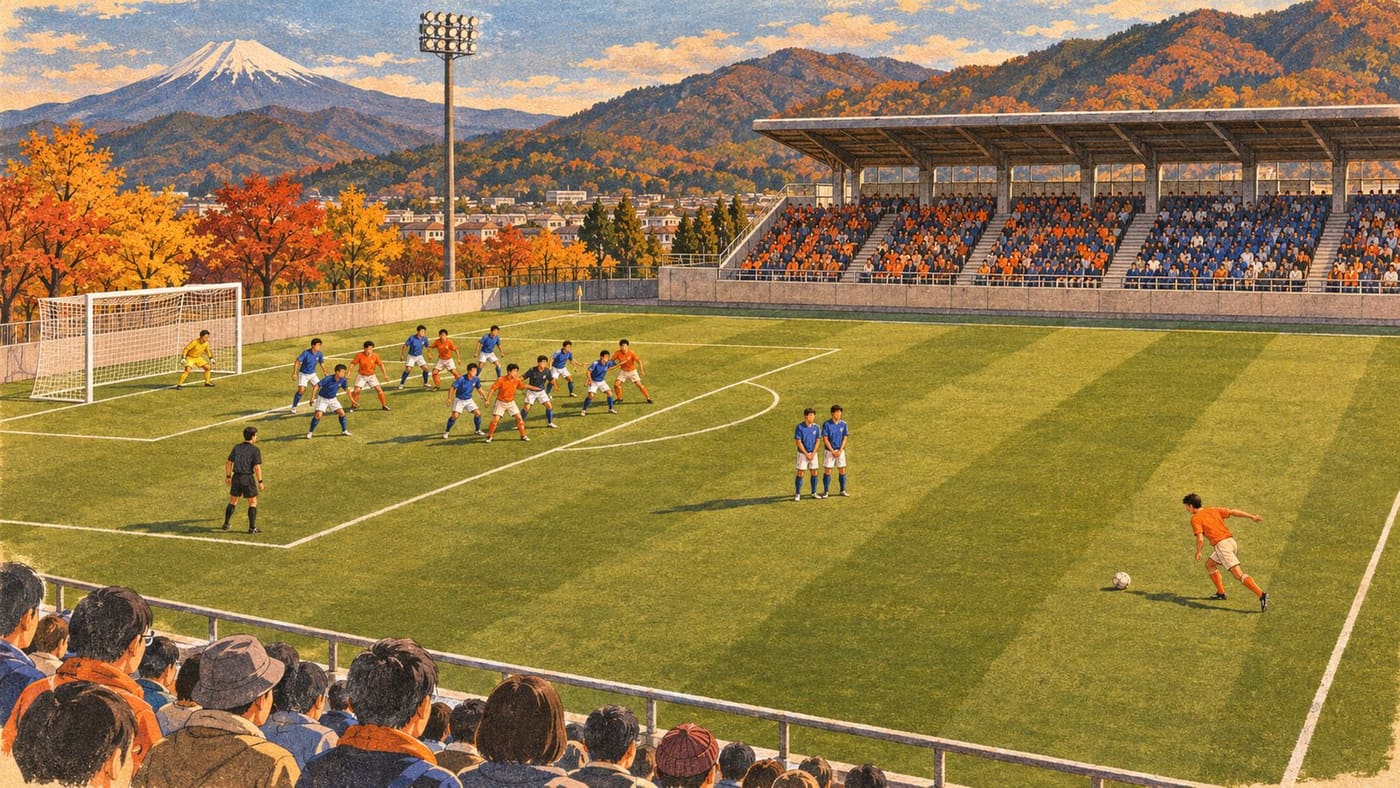
Albirex Niigata beat Ventforet Kofu 1–0 at JIT Recycle Ink Stadium on 3 November 2026. Michael James scored in the 89th minute, heading in a free kick delivered by Yuji Hoshi from the right. The result took Niigata to 29 points and first place in the J2 League table published that afternoon. Kofu finished matchweek 15 in 20th place on 12 points. J.League match summary · Official J2 standings
The score tells you how close the match remained. The box score tells you why a quick explanation based on volume alone falls short. The league records nine shots and three on target for each side. Niigata also had more of the ball, while Kofu took more corners. The winner came from a different sort of restart altogether. To understand the result, start with what the late free kick allowed both Niigata substitutes to do.
The play that broke the tie
The J.League’s Japanese match report describes a free kick on the right, a right-footed delivery by Hoshi and a header by Michael James from the central part of the penalty area. The header found the lower-left area of the goal as described by the league report. The English summary gives the time as the 89th minute. Its event list expresses the same timing as the 44th minute of the second half. Japanese match report and goal description
The sequence gives a replay viewer two distinct things to follow. The first is the flight of Hoshi’s delivery. A ball played from the flank can pull defenders toward the point of service while the actual contest develops several metres away. The second is where James meets it. The report places the header centrally, which helps distinguish the finish from a direct free-kick shot or a loose ball put away at the far post.
A wide replay would help answer questions the written account leaves open. Where was James when Hoshi began his approach? Did James move across a defender, arrive from behind one or already occupy the central space? How did the defending line move while the ball was in the air? The official text supports the delivery and finish. It gives readers no reason to name a defender as responsible or to infer a rehearsed blocking move. The useful distinction is between what the ball did and what the replay might reveal about the players around it.
The minute matters too. At 0–0, one goal was enough to turn a prospective draw into a lead. With regulation time nearly spent, Kofu then had only the remaining match time to find a reply. The league shows a Kofu booking deep in stoppage time, so the 89th-minute goal was followed by further play. “Late winner” describes the moment more accurately than “last kick.”
Two substitutes with different roles
James entered in the first half, replacing Jason Geria in the 25th minute according to the league’s event record. Niigata also introduced Fumiya Hayakawa at that time. Hoshi came on for Tomoya Osawa in the 16th minute of the second half. When the two substitutes combined late on, James had already been on the field for most of the match and Hoshi had been on for much of the second half. Neither was a last-minute attacking introduction. Official lineups and event record
That timeline gives more context than calling the goal a bench contribution. The first substitution brought on the player who eventually attacked the cross. A separate change brought on the eventual taker. Once Niigata won the free kick, a defender who had been on since the first half could take up an attacking position in the box, and a midfielder introduced later could deliver from the flank. The goal records how those roles came together at a single restart.
If you want to assess the substitutions themselves, separate the result of this one play from the longer period in which each replacement was on the pitch. The set piece shows James and Hoshi making decisive contributions. To understand the earlier effects of the changes, compare where Niigata recovered the ball, how the team restarted possession and whether its defenders faced different runs after the first-half changes. A list of substitutions gives the timestamps for making that comparison. A full match or detailed event record would give the evidence to draw conclusions.
The official lineups label Kofu’s starting shape 3–4–2–1 and Niigata’s 4–2–3–1. Those labels help you read the starting teams. They are less useful for reconstructing a late dead-ball situation. At a free kick, the usual defensive or midfield line can give way to a set of positions organised for the delivery. For this goal, the scorer’s listed position and the location of the header together tell a clearer story than a formation label on its own.
What nine shots each can tell you
The official summary’s full-time totals show nine shots per team and three on target per team. The equal counts are a useful starting observation. They leave room for differences in distance, angle, pressure and the type of delivery that created each attempt. An unpressured header near the centre of the area and a shot taken from a narrow angle both add one to the shot count. The count alone treats them alike.
One way to watch the match back is to group attempts by how they start. Put shots immediately following a restart in one group and shots created in continuous play in another. Then look at where each player makes contact. A shot from a set piece may come after a clearance or a second pass, so make your cutoff explicit. For this game the goal is easy to classify because the official report connects the header directly to Hoshi’s free-kick delivery. Other attempts may need a longer look.
Next, use the on-target count as a check on the result rather than as a rating of the finishers. Each team put three attempts on target according to the same official record. Niigata converted one and Kofu converted none. The match summary gives enough information for that narrow statement. Comparing the goalkeepers or claiming one side regularly found better positions would require more detail about the chances and saves. The gap between one converted attempt and zero is what decided this particular result.
Possession provides another contrast. The league lists 61 percent for Niigata and 39 percent for Kofu. The side with the greater share of possession had the same number of shots. That makes it worth asking where possession took place and how each team moved from circulation to an attempt. For example, a long passing spell across the back can count towards possession without producing a shot. A brief attack following a recovery can end in an attempt after only a few touches. Those are viewing questions, and the totals do not say which occurred most often.
The corner count and the free kick
Kofu’s six corners and Niigata’s three may catch the eye on the match page. Yet the winning delivery was a free kick from the right. If you start with corners as a measure of set-piece opportunities, you will leave out the very restart that produced the goal. A useful review groups corners and crossing free kicks separately, then identifies which deliveries actually led to a touch or attempt in a useful area.
Corners begin at a fixed location. A free kick can start closer to the box, farther out or at an angle that changes the available delivery. The location affects how much space there is behind the line and how quickly the ball can reach the first contested area. Even two free kicks from the same flank can ask different questions of a defence. The league’s wording gives the side of the pitch and the zone where James headed the ball, but the exact distance and angle are better left to the footage.
For a simple review of this match, put the goal alongside one of Kofu’s corners. Pause before each kick and notice where attackers can run. Then pause at first contact. Did the delivery give the receiver a chance to direct the ball, or was the first touch a clearance? This comparison can teach more about those two passages than counting how often each team restarted play near the penalty area. It also leaves space to acknowledge that a well-delivered ball sometimes produces nothing because the defence wins the first contact.
Where both clubs stood after matchweek 15
The official table marked 3 November at 17:14 Japan time put Niigata first on 29 points from 15 matches. Kataller Toyama and Yokohama FC followed on 28. Kofu sat 20th with 12 points, level on points with FC Imabari and Tochigi City. Those positions are a dated snapshot. When a reader opens the same standings link later, the table may reflect subsequent matches. Official standings with update time
The points arithmetic explains the immediate value of the header. At the final whistle, a 1–0 win brought Niigata three points and left Kofu with none from this fixture. If the score had stayed 0–0, each would have received one. Relative to that hypothetical draw, the result was worth two more points for Niigata and one fewer for Kofu. This is a comparison with a specific alternative match outcome. It does not assume anything about how the other teams’ matches might have played out.
The table also shows why position and scoring record answer different questions. At that update Niigata had scored 22 and conceded 24, a goal difference of minus two, while sitting first on points. The arithmetic is straightforward. Nine wins account for 27 points and two draws supply the other two. A large defeat can make a substantial change to the goal difference, while a narrow win still earns the same points as a large win. The two columns can therefore describe different aspects of a team’s season even when both are correct.
For Kofu, the fact that three clubs shared 12 points gives more context than the last-place label on its own. The listed goal differences were minus seven for Tochigi City, minus 15 for Imabari and minus 18 for Kofu. Those figures describe the table as published that afternoon. They also show why a reader looking at future updates should check both matches played and points before inferring how far a club is from its neighbours. On the dated table these clubs had each played 15. J.League round results
For another example of how to read a football table, see our Champions League table guide.
A result to read in two passes
The time on the fixture is another useful cross-check. The club advertised a 14:00 start, while the league recorded kickoff at 14:03 Japan time. A preview and a completed match page can therefore show slightly different times for the same game. Check the date, venue and matchweek together before deciding that two records disagree. The completed match page also distinguishes the kickoff time from the 89th minute of play, which is measured by the match clock. Both details help a reader find the correct entry in the round results.
Start with the event. The match was goalless until a free kick from the right gave Hoshi a chance to deliver and James a chance to head at goal. The league confirms that the effort went in and was the only goal. Its match record lists 8,350 spectators and gives the final score as Kofu 0–1 Niigata. For the home club’s fixture context, the club labels the game the 15th round of the 2026/27 J2 season. Ventforet Kofu match page
Then read the totals and table as separate pieces of evidence. Equal attempts and equal on-target numbers make the method of the winning goal worth a closer look. Niigata’s edge in possession and Kofu’s lead in corners give a viewer two more questions to take to the footage, neither of which changes the recorded score. The standings show what the three points meant after the rest of the round was accounted for. Keeping the event, the match totals and the table in that order is the simplest way to explain how a single late header changed the afternoon for both teams.