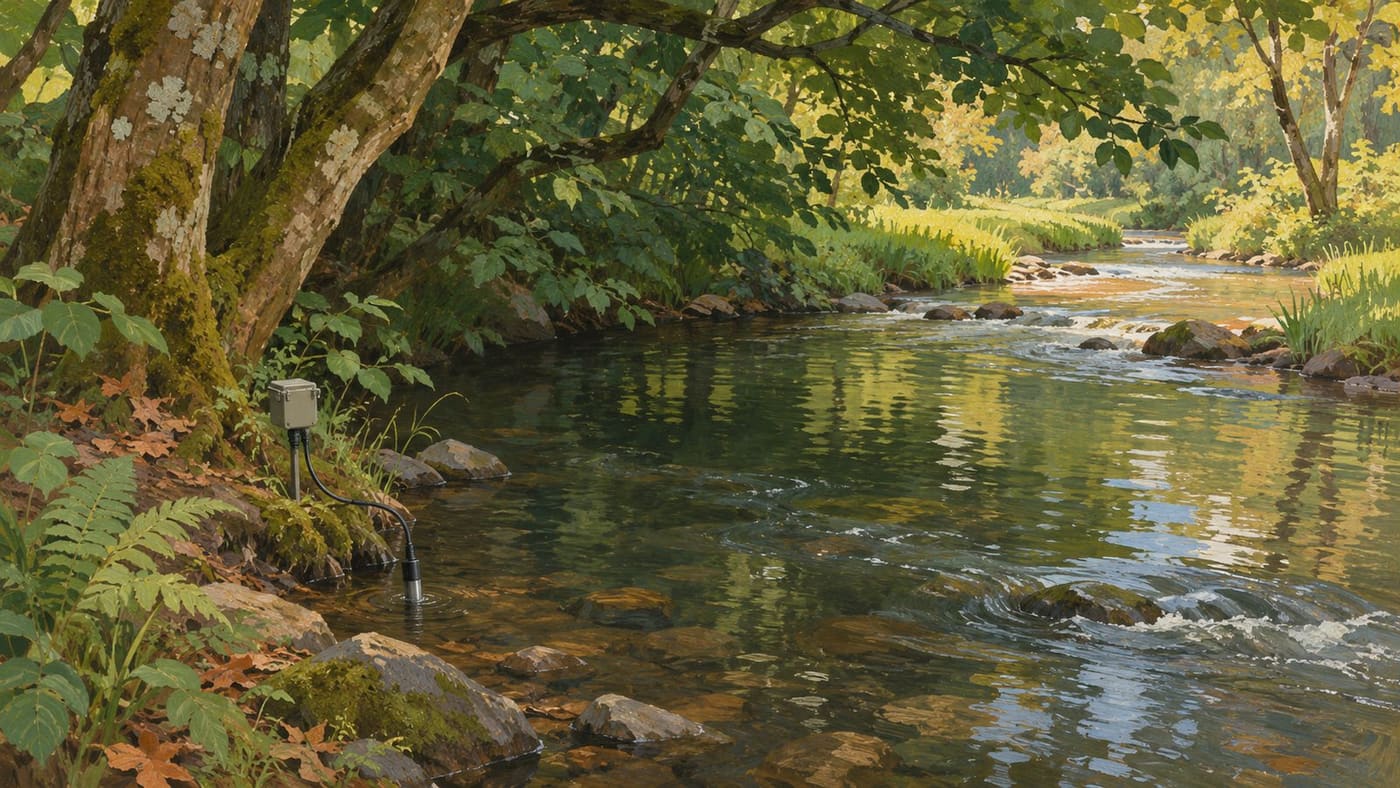
A stream thermometer gives you the temperature at a particular place and time. That is useful information, but a reading taken under trees in the morning cannot answer the same question as a reading taken downstream in the afternoon. If the second reading is higher, the difference might involve shade, the hour, inflows or several of those factors at once. The first step is deciding what comparison you want to make.
Streamside trees can change the amount of sunlight reaching the water. The temperature still reflects the water arriving from upstream and what happens along the reach. A useful monitoring plan separates the observation, such as two different readings, from the explanation you hope to test. That distinction matters whether the question comes from a restoration group, a classroom or a local report.
Decide what the reading needs to explain
The EPA volunteer stream monitoring manual discusses sources of temperature variation, including weather, shade, groundwater and other inflows. It also explains that temperature can vary across a stream and with depth. Choose a repeatable location and record where a reading was taken. If the reach is unsafe or inaccessible, use existing records or an approved monitoring site instead of entering it.
Suppose a group wants to know whether the water warms along a particular exposed reach. That is a question about change between two points under defined conditions. A different group might want to know how often a location becomes warm during summer afternoons. That calls for repeated measurements at that location. One pair of readings cannot replace a seasonal record, and a seasonal record at one point does not describe where the change occurred.
Write the question before choosing the measurements. Include the reach or location, the time period, and the comparison that would support an answer. If you only have one reading, label it with its place and time and describe what it shows. It can still help you choose the next question.
Compare places at comparable times
Imagine an upstream observation of 17 degrees Celsius at nine in the morning and a downstream observation of 21 degrees at three in the afternoon. The reported difference is four degrees. It is also a comparison across six hours and two sites. A sunny afternoon could warm both sites relative to morning. Before assigning the difference to the reach, try to obtain paired readings over the same period and note the local conditions at each site.
If two groups can measure safely at the same time, give them the same instructions about sensor position and recording. If one person has to visit both sites, record the actual times and preserve the gap. Shortening that gap can improve the comparison. It does not eliminate it. If the question involves a moving pulse of warm or cool water, measurements made at the same clock time may also describe different parcels of water. A paired reading is still useful, but interpreting movement through the reach may require flow information and more frequent measurements.
Draw the sites on a map and note what lies between them. Look for a tributary, a pond outlet, a culvert or a place where groundwater might enter. A shady bank upstream and an open bank downstream may be easy to see, while an intervening inflow is less obvious. Document the possible influences. Treat an unexplored inflow as an open question rather than adjusting a number by guesswork.
Keep the sensor position part of the measurement
A reading along the bank may describe slow shallow water. A reading from a different position may describe faster water or another depth. Decide which part of the stream the result is meant to represent. Repeat the same placement as closely as the site and safe access allow. If you move to a new position because a bank is flooded or the channel has shifted, record the change. A sequence of numbers remains useful when the record tells you which readings are comparable.
The US Geological Survey field manual on temperature describes equipment selection, verification and reporting for water-temperature measurements. The methods are written for professional data collection. A community group can draw a practical lesson from them: know which instrument made each reading, check whether it is working, and document conditions that might affect the value.
A logger can collect a series while nobody is on site, but it cannot tell by itself whether it stayed submerged. A receding stream can leave it exposed. A flood can move it. A sudden rise or fall in the series may be a real change or a reason to look at the deployment record. Compare it with field notes, water level observations and nearby data before assigning a cause. Keep the original data and mark uncertain intervals in a separate record.
Keep track of the shade the water actually gets
A photograph of trees on a bank can help describe a site, but it doesn't tell you how much of the water was shaded throughout the day. At one hour the trees may shade the channel. Later their shadows may fall on the bank. Channel direction, the height of the vegetation and seasonal changes in leaves all affect what the water receives. Record shade at the time of each visit and describe how much of the reach you actually observed.
Consider two sites with similar canopy above the bank. One is a narrow channel, where the shadow can stretch across most of the water. The other is a wider channel where much of the surface may remain exposed. A label such as wooded can describe the surroundings without describing the exposure of the stream. Distinguish the observations in your notes. Write down whether the surface you could see was shaded, partly shaded or exposed, and record any stretches you couldn't observe.
Shade is only one piece of a heat balance. Water brings a temperature with it when it enters the reach, and it continues to exchange heat with the surroundings. A cooler inflow can reduce the temperature downstream even in an exposed section. A shaded reach can receive water already warmed farther upstream. If the aim is to understand what a local tree planting might change, knowing those boundaries helps frame a question the measurements can answer.
Use several days to see whether a contrast repeats
Imagine the group obtains three afternoon pairs at comparable times. On the first day, the upstream site reads 18 degrees Celsius and the downstream site 20. On the second, the pair is 19 and 20. On the third, after rain, both read 17. The differences are two degrees, one degree and zero. These invented numbers show why a single visit can give an incomplete picture. The downstream site was warmer in two pairs, while the contrast disappeared in the third.
Compare the weather and site notes alongside the readings. If the first two days were clear and the third was cloudy, shade is one possible line of inquiry. Rain may also have changed the flow or brought water into the channel through another route. A group could plan more pairs under different conditions, document the main inflows or look for a nearby reach with different exposure and a comparable setting. Each step can address a question without requiring a conclusion the existing measurements don't support.
Preserve the individual pairs when summarising. A reader can see that a mean difference of one degree here came from three different contrasts. If one reading was missing, don't manufacture a pair by borrowing a measurement from a different day. Give the number of complete pairs and the number missed. Someone who comes back later can build on that record without first untangling its gaps.
Pick a summary that fits the question
A spot measurement, daily maximum and daily average serve different purposes. If the question is how warm the stream gets in the afternoon, a morning visit gives little direct information. If a logger records through the day, the highest recorded value is easier to interpret once the sampling interval and any gaps are known. It is the maximum of the available observations, which may miss a peak between them.
If the question is how long temperatures remain elevated, examine duration and continuity. A brief spike can make two days look similar when you compare only their highest observations. On one day the stream may cool shortly after the reading. On another it may stay warm for several hours. If a threshold is used in a report, explain where it came from and why it applies to that purpose. Don't turn an illustrative value into a universal limit for aquatic life.
For a comparison between groups, check the units, the time zone, the instrument and how the figures were calculated. Two charts can look similar while showing different things. A chart of daily averages should not be compared point for point with a chart of daily peaks. If the underlying observations are available, calculate the same summary on both sides before interpreting a difference. If they are not, describe the limits of the comparison.
Make a restoration comparison you can explain
Suppose volunteers want to assess a planting project. A useful plan begins before the planting, with a map, measurements and notes about the conditions already present. Identify the dates and reaches that will be compared, and decide whether a nearby reference reach can help interpret changes affecting the whole stream. Choose a reference with a clear rationale. A narrow shaded tributary is unlikely to answer every question about a broad channel downstream of a pond.
Check again after the work using comparable times, locations and measurement procedures. Record the actual growth and shade where feasible. Planting trees and producing shade across a reach are different milestones. A follow-up shortly after planting can document what was installed, but it may take later observations to show how exposure has changed. An unusual summer or a change upstream can affect the results even when the project has been carried out as planned.
Say what the evidence can support. If temperatures fell at both the planting and reference reaches in a cooler year, the pattern might reflect regional conditions. If changes differ between the two reaches, describe that observation and then examine what else differs. An honest report can recognise progress on the ground and still reserve judgment about how much temperature changed because of the planting.
Leave enough information for another visit
A compact record can include the site, date, time and time zone, units, position of the sensor, instrument identifier, recent conditions, shade and any interruption or uncertainty. If two people worked together, write down who recorded what. Keep raw observations available when you revise a graph or correct a field note. A correction is easier to trust when the earlier value and the reason for changing it remain traceable.
Keep the observation date separate from the date on which someone transcribed or corrected the record. That distinction helps readers align the measurement with weather or water-level notes from the same day.
Before making a claim, ask someone else to read the notes and explain what was measured. Can they tell whether a number refers to the whole reach, a single point or a series from a fixed sensor? Can they identify a missing visit or an exposed logger? If not, improve the description before collecting another table of numbers.
Start with a question and a repeatable observation. Use paired or repeated readings as the question requires, and keep the parts of the environment that might explain a difference visible. A stream temperature can tell a useful story when the record makes clear which water was measured, when it was measured and what the comparison can establish.
For another example of separating an observation from a proposed explanation, read how researchers interpret Bennu sample measurements.
Sources and research note
Sources checked November 3, 2026. The EPA volunteer monitoring manual and the USGS field manual inform the discussion of temperature variation, placement and equipment. All temperatures and site scenarios are conceptual. No field measurements were taken for this article.