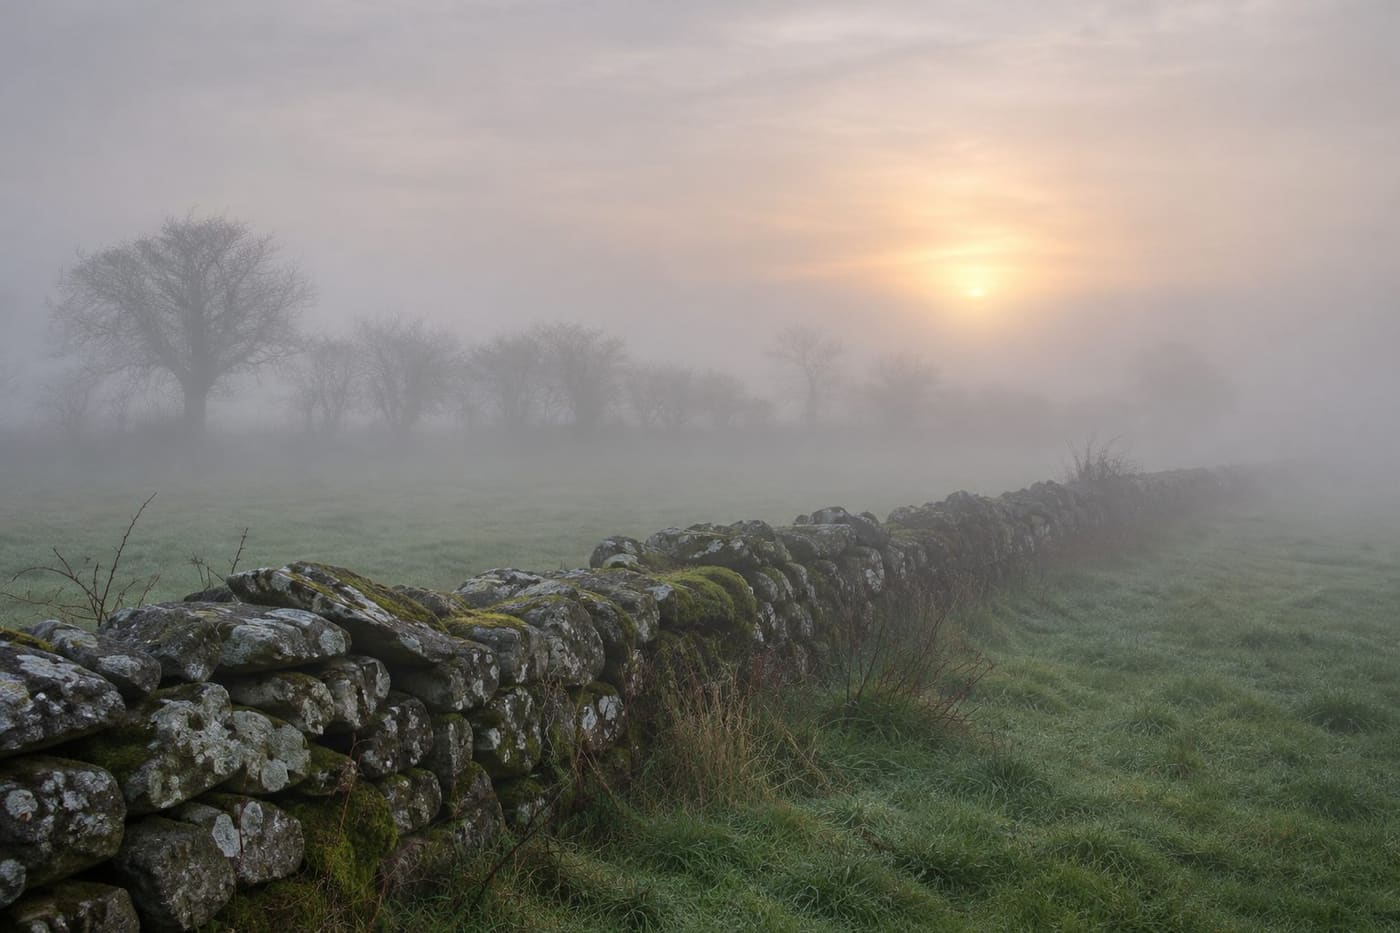
Met Éireann’s 05:30 national forecast for Saturday, 7 November 2026, described dense fog in parts of Ireland, especially across the southern half of the country. It expected gradual improvement, with fog lingering into the afternoon in some places, and forecast daytime highs of 7 to 11°C. The forecast described light winds and a renewed risk of dense fog overnight. The UK Met Office, meanwhile, had reported signs of a developing disturbance high above the Arctic. The two updates addressed different questions. The Irish forecast described conditions near the ground that weekend. The UK analysis examined a process high in the atmosphere and its possible influence later on.
The query “ireland polar vortex weather forecast” appeared third in an Ireland Google Trends snapshot retrieved at 13:10 UTC on 7 November. It showed 10K+ and was marked Active in the past-24-hours view, sorted by descending search volume, with all categories and trends included. Related searches included fog and yellow fog warning. The search cluster explains why readers might encounter both subjects together. It does not establish a meteorological connection between them.
What Met Éireann forecast for 7 and 8 November
The Met Éireann national forecast consulted for this article was issued at 05:30 on 7 November. It anticipated a dull start with dense fog in places. Bright intervals were expected to develop as the fog lifted, although some places could stay foggy into the afternoon. The forecast distinguished the largely dry conditions expected farther south from patchy rain and drizzle farther north, especially in Ulster.
For Saturday night, the same forecast described generally dry conditions apart from a few coastal showers, with dense fog developing in many areas and lows of 1 to 6°C. It expected Sunday morning fog to clear gradually, with some lingering into the afternoon, and another cool day. Those figures and descriptions belong to the issue available at the time of research. The linked page updates, so a later visitor may see a different date or a revised forecast.
One useful detail is how the forecast separates a national pattern from local variation. A forecast can mention areas of dense fog and bright intervals on the same day because it covers a large area and changing conditions. A forecast high is also a daytime temperature range, not a measure of the overnight minimum. Readers comparing two accounts should check which period each number describes.
The national forecast gives the broad picture. The Met Éireann observation display shows the separate role of observations for a selected location. An observation describes what has been measured or reported at that station at a particular time. The forecast describes what the forecaster expects. A Dublin observation cannot tell you what conditions were like in every part of the southern half of Ireland, and an outlook cannot tell you whether fog is already at a particular station.
Why fog can persist on a calm November morning
Fog is a cloud of tiny water droplets near the surface. One way it develops is when air close to the ground cools enough for moisture to condense. In the right conditions, the ground loses heat overnight and cools the air in contact with it. Light winds can allow that cool layer to persist. This is a general explanation of radiation fog, rather than a diagnosis of every fog patch mentioned on 7 November.
The Met Éireann overview of Ireland’s climate describes how fog can be slow to clear in November when incoming solar energy is weak. That helps explain why sunrise is not necessarily the end of fog. The rate of clearing can vary from place to place. Even nearby areas can have different cloud cover, wind or local exposure, and a single observation is only one point in a wider picture.
A useful thought experiment is to imagine two places under the same broad forecast. In one, the low cloud lifts and sunshine starts warming the ground. In the other, fog remains thick enough to limit the sunshine reaching the surface. The temperature and visibility may develop differently despite the shared regional outlook. You would use observations and updated local forecasts to establish what actually happened, rather than assuming both locations followed the same timetable.
This near-surface explanation operates on the scale of a night and a morning. The polar vortex analysis concerns circulation much higher in the atmosphere and how changes might influence broader weather patterns later. A cold morning is consistent with many processes, so the temperature at one location cannot identify the state of the vortex on its own.
What the UK Met Office said about the polar vortex
In a 4 November analysis, the UK Met Office described a disturbance in the stratospheric polar vortex with signs that a sudden stratospheric warming could be developing. The report was about the Arctic stratosphere and possible implications for the UK. Its discussion of wider atmospheric processes is relevant background for Ireland. The report does not replace Met Éireann’s forecast for an Irish town or county.
The Met Office explanation of the stratospheric polar vortex describes a band of winds that circulates around cold air high above the Arctic in winter. A disturbance can weaken the winds or alter the vortex’s shape and position. During a major sudden stratospheric warming, the winds can reverse in the mid-stratosphere. The warming in that name refers to temperature changes aloft.
The Met Office introduction to sudden stratospheric warming describes how effects can take weeks to influence the surface. If the circulation lower down responds, the position and behaviour of the jet stream can change. That can affect where high and low pressure systems sit and which direction air moves across parts of Europe. The chain has several steps, and a development at one step does not establish the outcome at the next.
The November analysis is therefore a useful example of a developing situation. Meteorologists can report evidence of a disturbance without having enough evidence to predict a specific day of snow or frost in Ireland. For a reader, the right question is what the source has observed so far, then what it says could happen if later conditions line up.
How a broad pattern becomes a local forecast
The Met Office explanation of blocking patterns describes how persistent pressure patterns can redirect or slow weather systems. Blocking can change the flow over the North Atlantic and Europe, but where the high pressure sets up matters. Its position helps determine whether winds reach a particular place from the Atlantic, the continent or farther north.
Even a forecast of colder air over a region leaves several local questions open. A place can be cold and dry. Another may have enough moisture for precipitation. Whether snow falls depends on conditions through the relevant depth of the atmosphere as well as on the air close to the ground. A description of a vortex disturbance contains too little information to answer all those local questions.
The Met Office’s overview of factors affecting UK winters also puts the polar vortex among several influences on seasonal conditions. The usefulness of that perspective is that it discourages treating one atmospheric feature as a forecast by itself. A specific Irish forecast needs an assessment of the pressure pattern, air mass and expected local conditions for the place and date in question.
Consider how the evidence would change over time. An analysis could first identify unusual winds in the stratosphere. Later forecasts might show whether the circulation lower down is likely to respond and how the Atlantic pressure pattern could develop. A short-range forecast could then specify likely temperatures or precipitation in parts of Ireland. Each update adds a different piece of information. The farther along that sequence you are, the more directly the evidence can address an individual day.
A practical way to read two apparently conflicting headlines
Suppose one headline says forecasters are watching for a vortex disturbance and another says Ireland is due to have dense fog over the weekend. Read the dates and the area covered by each source before deciding that they disagree. The first statement can concern a change aloft and a possible response over weeks. The second can concern visibility and temperatures near the ground over the next day or two. They can both be accurate.
Next, identify the verb doing the work. “Observed,” “developing,” “possible” and “forecast” describe different levels of knowledge. An agency may observe a change in the stratosphere and describe a possible surface response. Quoting only the surface outcome while omitting the conditions attached to it changes what the agency said. A specific snow date or a claim that the Arctic development caused a given fog bank would need more direct support.
Finally, compare the issue times. A morning national forecast and an analysis published three days earlier can still be useful when clearly labelled. A page that refreshes may no longer show the text a headline quoted. If you are comparing older accounts, record the date and time of the issue and keep the headline’s claim separate from the actual forecast language.
Match the scale of the evidence to the claim
A helpful way to check a claim is to sketch the distance it covers. A station observation describes a point near ground level. A national forecast covers an island or a broad part of it and may describe different conditions within that area. A stratospheric analysis looks at a much larger circulation. A claim that jumps from the third scale to the first needs evidence connecting the intervening steps. The mere presence of a cold or foggy morning supplies very little information about those steps.
Time works the same way. If a forecast says fog could linger in places on Saturday, look at what was observed on Saturday. If a longer-range discussion says a circulation change could influence weather in the weeks ahead, compare it with later updates at that range. A photograph of fog may be good evidence of limited visibility at the place and time of the photograph. It cannot by itself show what generated the regional weather pattern.
This matters when a news feed groups several stories under the same search term. You might see a scientific explanation, a local forecast and a travel notice side by side. Each can be useful. Label them before comparing them: what happened aloft, what the forecast expects locally, and what action a local notice advises. Then you can check each claim against the source that actually addresses it.
Where to check when visibility is the immediate concern
Start with the current national forecast, then look for the location and period that matter to you. Check Met Éireann warnings and advisories for a live notice and read the area and validity period together. The Met Éireann warning system explanation describes fog within its warning criteria. A snapshot of a search result does not show whether a warning has been revised or ended.
If you only need to decide whether poor visibility might affect your morning, the latest local forecast and warnings address that question directly. If you are following the possible longer-range influence of the Arctic disturbance, a later update from the forecasting agencies is the more useful evidence. For a fuller account of reading Irish warning areas and times for travel, see our Irish yellow weather warnings guide.
A person comparing forecasts across the island should check the issuing agency as well as the place. Met Éireann’s weather warnings explanation identifies the Met Office as the issuer for Northern Ireland. A general national outlook can mention weather in Ulster, while warnings are issued for the relevant jurisdictions. This distinction matters when a headline uses “Ireland” without saying which warning map or provider it is quoting.
The most useful reading of the 7 November sources is that Met Éireann forecast a cool, foggy period with local variation, while the UK Met Office was monitoring a development high above the Arctic. The sources reviewed give no basis to assign the Saturday fog to the polar vortex. Keep the two timescales separate and return to the current forecast for the area and period you need.
Sources consulted 7 November 2026. The dated forecast is an example from a live page. The image is an original conceptual illustration of fog in the Irish countryside.