BOOK LIBRARY · Complete books · Purchases disabled
TrendWindow

← Book Library · Complete book

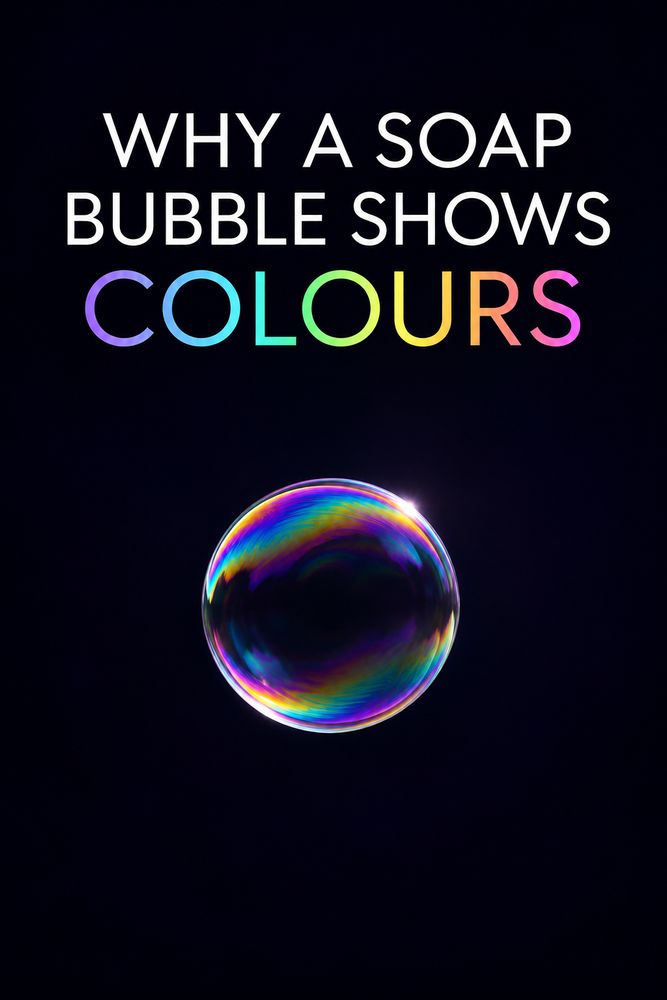
Front cover of Why a Soap Bubble Shows Colours

Science, Technology & Nature

Why a Soap Bubble Shows Colours

By TrendWindow Library

Follow two reflected beams through a soap film and see how angle, thickness and drainage shape its colours.

Read this complete edition, including its ending and notes. No purchase is required.

1. The Colour That Was Not in the Bottle

Imagine a thin soap film stretched across a loop. The liquid in the container looks nearly clear. Lift the loop into white light and turn it until you catch a reflection. A strip of green may sit beside a strip of violet. Wait, and the border moves. You can begin with three observations. The colour depends on where you look, it depends on the angle, and it can change while you hold the loop still. A single explanation has to make room for all three.

The first useful change is to look at a flat film before looking at a bubble. A bubble has a curved surface, so different parts face you at different angles. A flat film makes it easier to change the angle of the whole surface and see what follows. University teaching demonstrations use reflected light from a soap film to show bands that evolve with time. The film can change even when the lamp and the observer stay in place. Something within the film must be changing too.

A dark background can make the colours easier to see. It reduces competing light arriving through or from behind the film. The bright patch you are looking for is a reflection, and even a clear material can reflect a portion of the light reaching it. Think of a window that shows both the street outside and a pale image of the room behind you. A soap film likewise sends some of the arriving light back. Its unusual colours begin because it has two reflecting boundaries very close together.

2. Two Ways Back

Follow a narrow beam towards the film. At the first boundary, where air meets the film, part of the light is reflected. Part continues into the film. Some of that transmitted light reaches the far boundary, where the film meets air again, and is reflected there. It travels back through the film and a portion emerges towards the observer. The two returning contributions come from the same arriving light, but one has made a longer journey.

To understand what happens when they meet, picture the repeating rise and fall of a wave. When two waves reach the same place with their rises lined up, their combined variation can be larger. When the rise of one lines up with the fall of the other, their variations can partly cancel. This is interference. It is the relationship between the repeating patterns, called their phase relationship, that matters. The act of adding two waves is different from piling two layers of coloured ink on a page.

The second reflection travels through the layer twice, in and out. At a perpendicular view, the extra geometrical distance inside the film is twice the film thickness. The phase acquired over that path also depends on how light propagates inside the film. At an angle, the emerging contributions have to be compared along their common outgoing direction. Simply using the longer diagonal distance in the liquid without accounting for where the two rays emerge gives the wrong comparison.

The two principal reflections give a workable first explanation. Some light can reflect more times within the film, and the real brightness also depends on how strongly each boundary reflects. The simple picture explains why nearby portions of one film can favour different wavelengths. To see which wavelengths they favour, we need to add one detail about reflection itself.

3. The Turn at the Boundary

A reflection can change the phase of a wave. For light close to perpendicular incidence on an air–soap-film–air layer, the reflection from air towards the film has a half-cycle phase reversal. The reflection from inside the film towards air does not have that same reversal. Imagine comparing the two returning waves with the travel contribution set aside for a moment. Their peaks and troughs already oppose one another because of the difference at the boundaries.

Now restore the travel contribution. For some wavelengths the extra travel brings the two patterns back into agreement. For others it leaves them opposed. In a basic near-perpendicular model, the extra optical path is twice the refractive index of the film times its thickness. The refractive index accounts for the shorter wavelength of light inside the material. A half wavelength of extra optical path can offset the half-cycle difference due to reflection and give stronger reflection for that wavelength. A full wavelength of extra optical path brings back the opposition.

Here is an illustrative calculation. Use a refractive index of about 1.33, roughly that of water, and choose green light with a wavelength in air of 530 nanometres. In this model, the first strong reflected maximum occurs when twice the index times the thickness is half of 530 nanometres. The thickness is roughly 100 nanometres. This is an estimate for the model at perpendicular incidence. It is not a reading from a particular soap film. Changing the angle, refractive index or wavelength changes the calculation.

One consequence appears if you keep increasing the thickness in that model. A wavelength that was favoured can become weak and later become strong again. There is therefore no single progression in which one colour always follows another from the thinnest region to the thickest. We can reason about a specific pattern when we know the illumination and something about the film. Colour alone leaves several possibilities open.

4. White Light and a Tilted Surface

White light contains a range of visible wavelengths. Consider a place on the film where the two contributions add strongly for some of that range and weakly for another part. What you see is the mixture that returns to your eye. The observed hue need not be the name of a single wavelength. It is the result of the incident spectrum, the reflection from the film and the way vision responds to the mixture.

Try the thought experiment with a lamp giving a narrow band of red light. The film can still interfere with itself, in the sense that reflected light from its two boundaries can add or cancel. Under that illumination the contrast is mainly between brighter and darker regions of red. With white light, the regions can change hue as the balance among wavelengths changes. This difference is one reason to ask what illuminated a photograph before comparing its colours with those of a live bubble.

Now turn the loop without waiting long enough for a large change in the film. When the angle changes, the phase difference changes. In a simple model, the travel part of that phase difference uses the cosine of the angle inside the film, measured from the perpendicular. The angle inside is related to, but generally different from, the angle in air. The same patch of film can therefore show different colours as it tilts, even if its thickness stays the same for that moment.

The curved bubble complicates the comparison in a useful way. Look at its centre and then towards the edge. The parts of the surface face different directions, and a lamp or bright window can illuminate them in different ways. A change of hue across the bubble may reflect a change of viewing geometry, a change of thickness, or both. This is why we began with a loop rather than trying to read a bubble as a map in the first minute.

5. The Film Has a History

Hold a film vertically and watch it without moving the light. The liquid can drain under gravity. As the distribution of liquid changes, the thickness changes at different points. Bands can drift, break into patches or change shape. Teaching demonstrations make it easy to see evolving bands. Experiments on films also track the evolution with instruments, because moving colours alone do not tell us exactly how the liquid moved.

A very thin patch can appear dark in reflection. With almost no extra travel inside the film, the phase reversal at one boundary leaves the reflected contributions largely opposed across the visible range. In favourable lighting, the reflected light from that patch is much weaker than the light from the surrounding bands. Darkness in reflection does not imply that the material became opaque. There may be little returning light even though light can pass through the film.

The evolution need not be a smooth downward sweep of colour. Liquid can move sideways, and a band is a contour in the optical pattern, not a stripe painted on a set of molecules. A band can shift as a thickness value moves from one part of a film to another. Watching a stripe move therefore does not identify the paths of individual bits of liquid. For that you would need a measurement that can distinguish a change in the pattern from transport of the material.

Eventually the film may rupture. A dark region is a useful observation, not a clock that tells you how long the film will last. Conditions differ among films and among parts of the same film. Air movement and the state of the liquid can change what happens next. For our purpose, the transition from a bright band to a dark patch shows how a change on a very small length scale can change a familiar sight.

6. Turning a Colour into a Measurement

Before reading a colour chart, ask what the chart predicts. It might show reflected colours under a particular lamp and at a fixed angle. That is a forward calculation. Estimating thickness from a photograph runs the reasoning in reverse. If several model thicknesses look similar to the camera, the photograph alone cannot choose among them. An independent observation can help. For example, a sequence of frames may show whether a patch is passing through a particular range of the model, even when one frame on its own is ambiguous.

Afanasyev, Andrews and Deacon describe an experiment that estimates soap-bubble thickness from colour matching. They use a camera and controlled illumination. Their procedure uses information about geometry and the way recorded colour relates to an optical model. The important step is not merely taking a photograph. It is arranging the observation so that a comparison of colours can support a comparison of thicknesses.

Imagine trying to make the same claim from two snapshots taken by different phones. One camera may shift its white balance. One film may be lit by a window and another by an indoor lamp. A bright band may come from a different angle or from a different thickness that produces a similar visible mixture. A useful experiment keeps track of these alternatives. It can compare a sequence, constrain the geometry, and decide which range of the model fits the observations.

This also gives a way to record an ordinary observation honestly. Note where the light was, whether the film or camera moved, and how the pattern changed over time. Write down when you changed more than one condition. A stationary camera and fixed light make a useful comparison with a deliberately tilted film. Such notes will not supply a thickness by themselves, but they can help you tell a change you introduced from one you merely witnessed.

Return now to a bubble. A narrow ribbon of colour passes across it and a dark patch appears. There are two returns of light close enough to interfere, a curved surface that changes the geometry across your view, and a film whose thickness can change while you look. You could make a measurement if you controlled enough of those conditions. For a moment, you can also just watch the ribbon. It is a visible record of which parts of the light came back together.

Sources and Reading Notes

The University of Colorado Boulder’s [soap-film demonstration](https://physicslabs.colorado.edu/demos/optics/interference/thin-films/interference-in-a-soap-film/) and Harvard’s [thin-film interference demonstration](https://sciencedemonstrations.fas.harvard.edu/presentations/thin-film-interference) document reflected patterns and their development. Afanasyev, Andrews and Deacon’s [colour-matching experiment](https://doi.org/10.1119/1.3596431) describes an experimental method for estimating thickness from recorded colours. The [APS experimental abstract on soap-film drainage](https://meetings-archive.aps.org/mar/2014/b15/3/) describes imaging and spectroscopy for studying drainage. The 530-nanometre calculation in Chapter 3 is an idealised example, not data from those experiments. Sources consulted 4 November 2026.

Explore more books →