BOOK LIBRARY · Complete books · Purchases disabled
TrendWindow

← Book Library · Complete book

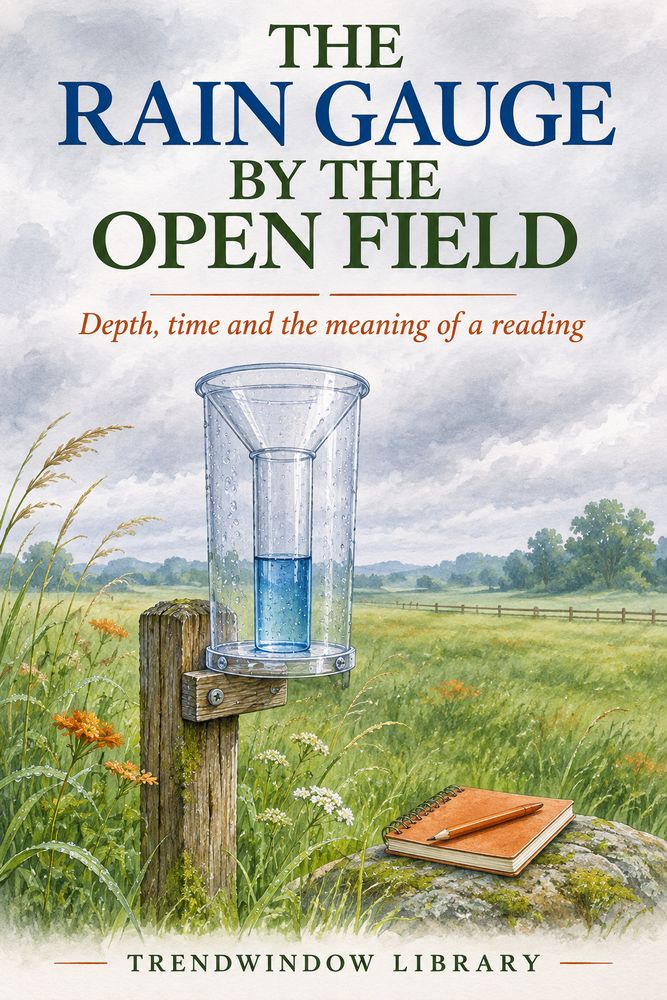
Front cover of The Rain Gauge by the Open Field

Science, Technology & Nature

The Rain Gauge by the Open Field

By TrendWindow Library

A complete original short science guide to rainfall measurements. Follow an imaginary notebook through collecting area, calibrated scales, siting, time windows and zero, trace or missing readings, with solved original examples and primary institutional sources.

Read this complete edition, including its ending and notes. No purchase is required.

1. A Depth, Not a Puddle

Mira writes 2.4 mm in a notebook. Before this number can tell us anything useful, we need to know what she measured, where, and over which period. Mira and her notebook are invented teaching examples. No weather station was installed or visited for this book, and none of its example readings is a real observation.

A rainfall depth expresses water collected over a horizontal area as an equivalent layer. It is not a prediction of the depth of a puddle nearby. A puddle also involves the shape of the ground and where water moves. The gauge asks a narrower question about its collector. That narrowness is a strength when we keep it visible.

Start with an original geometric model. Suppose a perfectly collecting horizontal square measures one metre by one metre. A uniform layer one millimetre deep on it has volume 1 m × 1 m × 0.001 m = 0.001 cubic metres, or one litre. A model depth of 2.4 mm over that square corresponds to 2.4 litres. Double the area while keeping the depth, and the volume doubles. The rainfall depth does not.

This distinction explains why a wider collector is not automatically reporting a wetter storm. It collects more volume from more area. An instrument's scale must relate collected volume to the area of its opening. We cannot compare raw volumes from differently sized collectors as though they were depths.

Mira's first notebook heading is therefore not merely Water. It is Rainfall depth, millimetres. Beside it she leaves columns for location, beginning and ending times, and a note about the instrument. The numbers in those columns will not make her gauge perfect. They will make it possible to understand which question a number answers.

Before continuing, answer a small model question: if an ideal two-square-metre collector receives a 3 mm layer, how much water is collected? The answer is six litres, not three. The depth remains 3 mm. The calculation describes an ideal collection geometry, not a promise that any improvised container is a calibrated gauge.

2. Why the Inner Tube Looks Deep

Some gauges concentrate water from a broad opening into a narrower measuring tube. A tall column inside the tube may represent a much smaller rainfall depth over the opening. Read the calibrated rainfall scale rather than assuming that the physical water height is the rain depth.

The US National Weather Service's Charleston equipment page describes its eight-inch Standard Rain Gauge. Eight inches names the collector diameter. Its measuring tube has one-tenth of the funnel's cross-sectional area, so one inch of rainfall produces ten inches of physical water depth in the tube. The marked stick already expresses rainfall in hundredths of an inch. The described inner tube holds 2.00 inches of rainfall before water passes to the outer can. These are specifications of that instrument, not every rain gauge.

An original model makes the area ratio visible without borrowing a station's data. Let collector area be 100 square centimetres and tube area 10 square centimetres. A 1.2 cm rainfall layer gives 100 × 1.2 = 120 cubic centimetres of water. In the tube that volume stands 120 ÷ 10 = 12 cm high. The rainfall depth is still 1.2 cm, which is 12 mm. A rainfall-calibrated scale would account for the ratio; multiplying its reading by ten again would introduce an error.

Capacity also needs its own label. The NWS Lincoln SWOP guide describes a different four-inch plastic gauge whose inner cylinder holds one inch of rainfall. Its overflow water is measured through the inner tube and added to the initial amount. Do not combine that one-inch capacity with Charleston's two-inch specification and invent a universal rule.

For an original overflow arithmetic exercise, suppose a gauge's known inner capacity is 25.0 mm and separately measured overflow is 8.6 mm. Total rainfall depth is 33.6 mm. This is arithmetic on stated hypothetical readings, not instructions to use an uncalibrated outer container's water height. Mira writes the instrument type beside the capacity so that a later reader will not silently substitute another gauge.

3. The Opening Has a Neighbourhood

A number belongs to a site as well as an instrument. A collector under a dripping roof and one in an appropriate open location do not ask the same sampling question. We need not invent a correction factor to acknowledge that difference.

The Lincoln guide asks its observers to use an open place away from obstructions and keep the gauge level. The Australian Bureau of Meteorology also warns about nearby buildings, solid fences and trees. It describes horizontal openings and secure placement, and notes that greater height can increase wind effects. Its own standard collector top is 0.3 m above ground. These details explain why a location note matters; they do not make a single height universal across networks and equipment.

Mira draws an imaginary plan of two possible sites. Site A is beside a shed under the edge of its roof. Site B is in an open area beyond a distant fence, with no overhead branches. For the exercise, B is the better candidate to investigate. That choice does not certify B as an official station. We have no measurements of its exposure, no equipment assessment and no local network approval.

She records the chosen position in words rather than writing Perfect site. A note can say that the collector is in the open, describe nearby objects and record a later move. If the gauge moves, the record should show the move instead of pretending every number came from one unchanged setting.

A useful correction to an overconfident sentence is: replace The neighbour's gauge is wrong with The two readings need comparable locations, instruments and periods before we judge their difference. We have not proved either reading right. We have identified missing information. The result of a careful comparison can be a better question rather than a winner.

4. Seven Days with an Unread Morning

A daily number needs a daily interval. The NWS Wichita observer packet asks for readings near the same time each morning and explains zero, trace and multi-day reports. The Bureau's Australian daily convention is 9 am local time, with the date of the check not necessarily the date the rain fell. The Met Office describes a traditional UK storage-gauge reading at 0900 UTC. Local time and UTC are not interchangeable labels, and one network's convention is not everyone's rule.

Here is Mira's original hypothetical notebook, all times local. The gauge starts empty on Monday at 07:00. Tuesday 07:00: 2.4 mm for 24 hours, then emptied. Wednesday 07:00: 0.0 mm for 24 hours, then emptied. Thursday 07:00: T for a trace during 24 hours, then emptied. Friday: not read. Saturday 07:00: 7.6 mm for the 48 hours since Thursday's emptying, then emptied. Sunday 07:00: 1.0 mm for 24 hours, then emptied. Monday 07:00: 3.0 mm for 24 hours, then emptied.

Friday is missing a separate daily reading. It is not a measured zero. Saturday's 7.6 mm covers two days; it is not evidence that all of it fell on Saturday. We cannot split it into 3.8 mm per day and call those observations. That would replace missing timing information with an equal-share assumption.

The quantified amounts sum to 2.4 + 0.0 + 7.6 + 1.0 + 3.0 = 14.0 mm, with the additional trace flag retained. This is not an exact claim that the entire week's water was precisely 14.0 mm. T records detected precipitation below the chosen reportable numerical threshold. It is not a known extra decimal that we can invent. In this fictional millimetre notebook, T has no numerical value assigned.

The Wichita packet's specific trace guidance uses amounts below 0.01 inch; that threshold belongs to its reporting context. Mira's invented T is not a claim that every millimetre gauge shares that exact rule. Her final summary states the measured intervals, the quantified sum and the unresolved trace. It leaves Friday and Saturday's individual daily amounts unknown. The week ends with a complete, honest record rather than seven tidy but invented daily numbers.

5. A Tip Is an Increment

Automatic instruments can count events instead of asking an observer to pour water into a measure. The Met Office describes a tipping-bucket instrument with a 0.2 mm increment. The Bureau also describes a 0.2 mm tipping point in its automatic gauges: a filled small bucket tips and produces an electronic pulse. That specified increment is not a property of every automatic gauge.

Use an original ideal counting exercise. Suppose our stated model records twenty tips of 0.2 mm each over thirty minutes. Its counted depth is 20 × 0.2 = 4.0 mm. Thirty minutes is half an hour, so the interval-average rate is 4.0 ÷ 0.5 = 8.0 mm per hour. This does not mean it rained steadily at 8.0 mm per hour, and it does not predict the next hour's total. Twenty tips in a short burst and twenty spread over thirty minutes can share this total while differing in timing.

The model assumes correctly registered tips and a suitable calibrated instrument. Real records deserve checks. The Bureau explains that a partly filled bucket can tip through vibration, and that dew, mist or sea spray may contribute water without rain. Therefore a single recorded tip on an apparently clear day is a reason to examine context, not automatically proof that the observer failed to notice a shower.

Mira marks a second invented exercise clearly: two tips equal 0.4 mm in this model; without the length of the observation interval, no interval-average rate can be calculated. The answer is not 0.4 mm per hour unless the interval was one hour. A unit attached to a number can look convincing while answering a question the record never supplied.

6. What the Notebook Can Finish

Mira returns to her first 2.4 mm entry and writes its full meaning: invented local reading at Tuesday 07:00, for the 24 hours beginning Monday 07:00, reported in millimetres for the named gauge at the recorded site. This sentence is longer than a number and much easier to compare responsibly.

Her completed page contains the 14.0 mm sum of quantified amounts, the trace flag, the separately unresolved Friday and Saturday daily amounts, and a note that the 7.6 mm is one 48-hour accumulation. She has not supplied local weather news or established a climate trend. She has finished the narrower task of keeping the original exercise's evidence separate from its assumptions.

Try three final questions. Can the weekly notebook identify the wettest individual day? No: the two-day accumulation cannot be assigned between Friday and Saturday. Can it show that Wednesday's measured interval was recorded as zero? Yes, within the fictional instrument and reporting limits. Can twenty 0.2 mm tips alone establish a rainfall rate? No: we also need the elapsed interval. These answers are deliberately different because the questions require different information.

This book is a reading guide, not a direction to purchase or install equipment, report to a network, or go outdoors during hazardous weather. A home gauge does not replace official forecasts, warnings or flood information. No new instrument or field record was needed to solve its examples. The completed notebook, with an honest gap and labelled arithmetic, is the ending of the exercise: a small measurement made useful by saying exactly what it can and cannot tell us.

Sources and Edition Note

Research date: 5 November 2026. Primary institutional sources read in their relevant rainfall sections: Met Office, How we measure rainfall; NWS Charleston, Cooperative Weather Observer equipment; NWS Lincoln, SWOP Rainfall Measuring Tips; Australian Bureau of Meteorology, Flood, river and rain gauges; NWS Wichita, Observer Information Packet, selected opening rainfall pages, not the complete nineteen-page packet. These are institutional explanations, not five independent experiments. A CoCoRaHS page could not be fully accessed and is not used as a fully read source.

https://weather.metoffice.gov.uk/guides/observations/how-we-measure-rainfall

https://www.weather.gov/chs/coop_equipment

https://www.weather.gov/ilx/swop-rainfall

https://www.bom.gov.au/resources/learn-and-explore/radar-and-equipment-knowledge-centre/flood-river-and-rain-gauges

https://www.weather.gov/media/ict/coop/NewObserverInformationPacketPrecipOnly.pdf

Mira, the notebook and all worked data are original hypothetical teaching material, not observed rainfall or an approved station design. Specifications remain attached to their named instruments and networks. Original AI-assisted educational writing and translations with editorial review; no independent human-authorship or native-human certification. Original conceptual English cover artwork is not a documentary station image. Digital edition without an ISBN or print proof.

Explore more books →