BOOK LIBRARY · Complete books · Purchases disabled
TrendWindow

← Book Library · Complete book

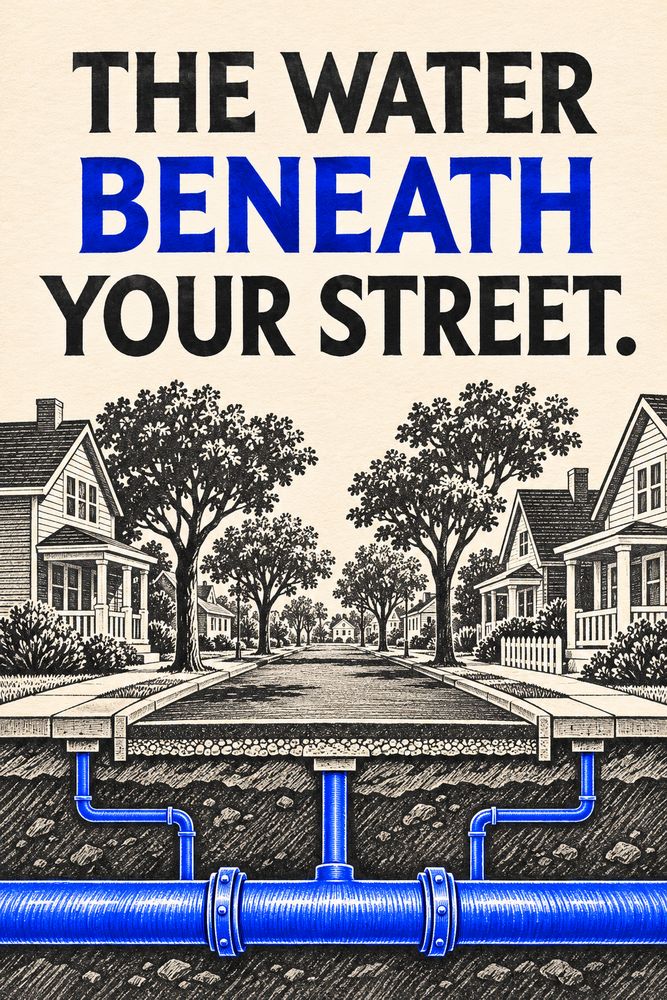
Front cover of The Water Beneath Your Street

Science, Technology & Nature

The Water Beneath Your Street

By TrendWindow Library

Follow a fictional street through the main, service lines, pressure zones, valves and storage that shape water distribution.

Read this complete edition, including its ending and notes. No purchase is required.

1. The Second Map

Imagine a short street with a bakery on the corner, a row of houses and a library at the top of a small hill. The street has a name and a set of numbers. Delivery drivers use that map. Beneath the pavement there is another map, made of connections that may cross those boundaries. A pipe feeding the library might approach from behind it. Houses on opposite sides of the road might share a main. A line that looks like the obvious path on a street map might end at a closed valve.

We will follow a fictional block. Its arrangement is deliberately simple. It lets us ask where water can move, what pushes it, and what changes when people start using it. Actual utility networks vary in design, ownership and operating conditions. The point of our block is to make it possible to think through one change at a time.

Begin with the pipe that serves the block. A distribution main carries water along a route where other pipes connect to it. A service line branches away to supply a property. The main and the service line have different jobs, even where both are underground and invisible. If a building is affected while its neighbours are not, the shared main is only one possible place to look for the reason. The part of the route shared by all the affected buildings is a useful clue, but it needs to be compared with what the utility actually knows about its network.

The distribution network is one stage of a larger system. Water has already come from a source and, in a public supply, passed through the processes used by that utility before reaching this part of the network. Water leaving a sink generally belongs to a separate story about drainage and wastewater. On our walk we stay with the supply side. We start at the shared pipe and stop where the route enters a building.

2. A Branch and a Loop

Draw the block as a horizontal line. Mark a junction at the left and two service connections farther to the right. The line stops after the library. With this arrangement, every delivery to those buildings comes through the left junction. If a segment must be taken out of service, the position of that segment matters. An interruption near the left end affects more of this simplified block than one near the right.

Now add a connection from the right end to a second main. The original branch is part of a loop. Under suitable conditions, water may reach a junction by more than one route. The lines on the paper show possible connections. They do not establish that an alternate route can deliver enough water when needed. That depends on whether the route is open, what pressure is available and what other users are drawing at the same time. A connection that helps during light demand may perform differently during a busy period.

A junction is a place where routes meet. In a model, it can also be a convenient place to represent demand. An engineer does not necessarily draw every indoor fixture. Demand from several buildings may be represented together at a junction, with a schedule that changes over the day. That simplification helps with some questions and limits others. A model built to investigate pressures across a district may have too little detail to say what happens inside an individual building.

A street map makes a block look fixed. A network drawing adds a useful layer of conditional statements. If this valve is open, the route exists. If demand changes, the division of flow can change. If an alternate path has too much resistance, it may contribute little when needed. The next step is to understand why water takes the routes it does.

3. What Pushes and What Resists

Pressure describes a push at a location. Flow describes water moving through a route over time. There can be pressure in a filled pipe even when no one is drawing water through that stretch. When a tap opens, movement depends on the available push and the resistance along the path. Thinking about the two separately helps explain why a measurement taken while little water is moving may differ from one taken during heavier use.

Height is part of the story. Imagine two branches connected to the same supply and assume for a moment that neither is drawing water. If one branch ends uphill from the other, its elevation accounts for some of the energy available from the supply. With the same upstream conditions, less is available there as pressure. This is one reason a city with hills may organise parts of its network into pressure zones rather than trying to serve every elevation in the same way.

Now open several taps in the example. Moving water loses energy to friction in pipes and to effects at bends and fittings. The size and condition of a pipe influence the resistance, as does the rate of flow. Water does not read the map and pick the line that looks shortest. Two routes between the same points can carry different amounts because their resistance and the pressures at their ends differ.

This gives us two separate questions to ask about the library. How much of its pressure difference is explained by the climb? How much appears only when water is moving? The first points us towards elevation and supply conditions. The second invites a look at demand, pipe resistance and the way the network is being operated. Both can matter at once. A single observation at a single hour rarely sorts them out.

4. The Tank and the Morning Rush

Put a tank above the block in the sketch. Connect it to the network and give it room to hold water. If conditions allow water to flow into the tank during a quieter period, the water level rises. If demand later outpaces the water arriving through other connections, the tank can contribute water as its level falls. Whether the tank fills or supplies water at a particular time depends on the conditions at the connection. A real system may use pumps and controls to manage those changes.

An imaginary morning makes the point. Suppose for ten minutes the buildings served by our little network use 30 litres each minute, and the other supply is bringing in 20 litres each minute. In a simplified balance with no other flows, storage supplies the difference, 10 litres each minute. After ten minutes it has given up 100 litres. Later, if the supply still brings in 20 litres each minute while use drops to 15, the excess can return to storage at five litres each minute. At that rate it takes twenty minutes to replace the 100 litres. These numbers describe our illustration and are unrelated to the capacity of an actual water system.

That arithmetic tracks the amount stored. It says little by itself about the pressure at the bakery or library. For that, we would also want to know the water level, the elevations and the resistance of the routes. A tall, narrow tank and a broad one could lose the same amount of water while their levels change by different amounts. The quantity held and the height of the water surface are connected through the tank’s shape.

Storage brings a question about time as well as quantity. Water age is the time water spends in the distribution system before use. Demand patterns, the movement of water through a network and the way storage turns over all affect that time. Water age can help operators investigate water quality, but it is one piece of evidence. It does not establish the quality of water at a particular tap without other information.

5. The Valve and the Work Zone

A valve can change which paths are available. Some valves isolate a stretch of pipe. Others perform different functions, such as regulating pressure or limiting flow to one direction. On the fictional block, draw an isolation valve at each end of a segment. If both are closed and there are no other open paths into the segment, that part is cut off from the rest of the network. The rest may still receive water through the loop, depending on where it connects.

Now imagine the segment contains a service connection. The new route may let water reach the main on either side of the isolated stretch. That does not restore a connection whose branch point lies inside it. This is why a map of mains alone gives an incomplete answer to a question about which properties are affected. A better diagram includes the service connections, the valves, and the current state of those valves.

A break can change pressure and flow in a much less orderly way. Water escapes, and the path feeding the escape competes with other demands on the network. Depending on the circumstances, a loss of pressure can raise water quality concerns as well as interrupt service. A utility considering its response needs information about the affected area, the condition of the network and what happened during the event. Our sketch gives a way to understand why those questions matter, while the answers for a real incident belong to the local operator and its published instructions.

You can see a valve cover from the pavement without seeing the network it controls. Think of it as a clue to a connection rather than a public operating handle. In our example, the line drawn across the block has become several segments with different dependencies. The discovery is that an interruption is a change in the set of possible routes.

6. What a Model Can Tell You

The US Environmental Protection Agency’s EPANET program models pressurised networks using components such as junctions, pipes, pumps, valves, tanks and reservoirs. A model can track changes in estimated pressures and flows over time, as well as quantities such as tank levels and water age. This makes it possible to compare situations that would be difficult or disruptive to reproduce on a real street.

Suppose a model says the library has adequate pressure at noon but less during the morning rush. That result suggests a difference worth investigating. It may depend on the demand schedule entered into the model, the assumed pipe properties or the level used for the tank. A good comparison with measurements asks whether they were taken under similar conditions. A midday reading may support a midday prediction while leaving the morning question open.

A model can also be useful when it is wrong. If repeated field observations differ from the prediction, the difference is information. Perhaps a pipe believed to be open is unavailable. Perhaps use is concentrated at a different time. Or perhaps a part of the system has been represented too simply. Checking one explanation at a time gives the engineer a chance to learn something rather than adjust several assumptions until one number happens to fit.

There is a smaller version of this practice available to anyone reading an account of water infrastructure. Ask what is measured and what is inferred. A reported tank level is a measurement if it came from an instrument. An estimate of how much flow uses each pipe can come from a model. Both can be useful if their dates, conditions and limitations travel with them.

7. Back to the Corner

We end where we began, at the bakery corner. A customer sees a row of windows, a crossing and a hill. The second map adds a main, a pair of routes around part of the block, an elevated supply and an isolation point. It still leaves things to learn. We would need the utility’s records to know which valves are open and which buildings share a branch. We would need measurements to know how pressure changes as the block wakes up.

The simple diagram has done its job when it helps us describe three changes without confusing them. Opening more taps changes demand. Opening or closing a route changes the network. Filling or emptying a tank changes how much water is stored and can change the level that helps supply it. A real morning may include all three at once. Separating them on paper makes it easier to ask which one the evidence points to.

The next time the pavement is opened, notice how little of the network the excavation can show. One exposed piece can tell you about its own material, shape and connections. Its role in the supply depends on what extends beyond both sides of the trench. The second map starts there, where the visible pipe disappears again.

Sources and Reading Notes

The US Environmental Protection Agency’s [distribution system overview](https://www.epa.gov/dwsixyearreview/drinking-water-distribution-systems) describes infrastructure variation and concerns associated with ageing pipes and pressure changes. Its [distribution system resources](https://www.epa.gov/dwreginfo/drinking-water-distribution-system-tools-and-resources) cover pressure, storage, water age and losses. The [EPANET engineering program and documentation](https://www.epa.gov/water-research/epanet) describe network components, flow, pressure, head loss and modelling over time.

The street, premises and storage arithmetic are fictional explanatory examples. None represents a particular utility’s layout, design limits or incident instructions. Sources consulted 4 November 2026.

Explore more books →