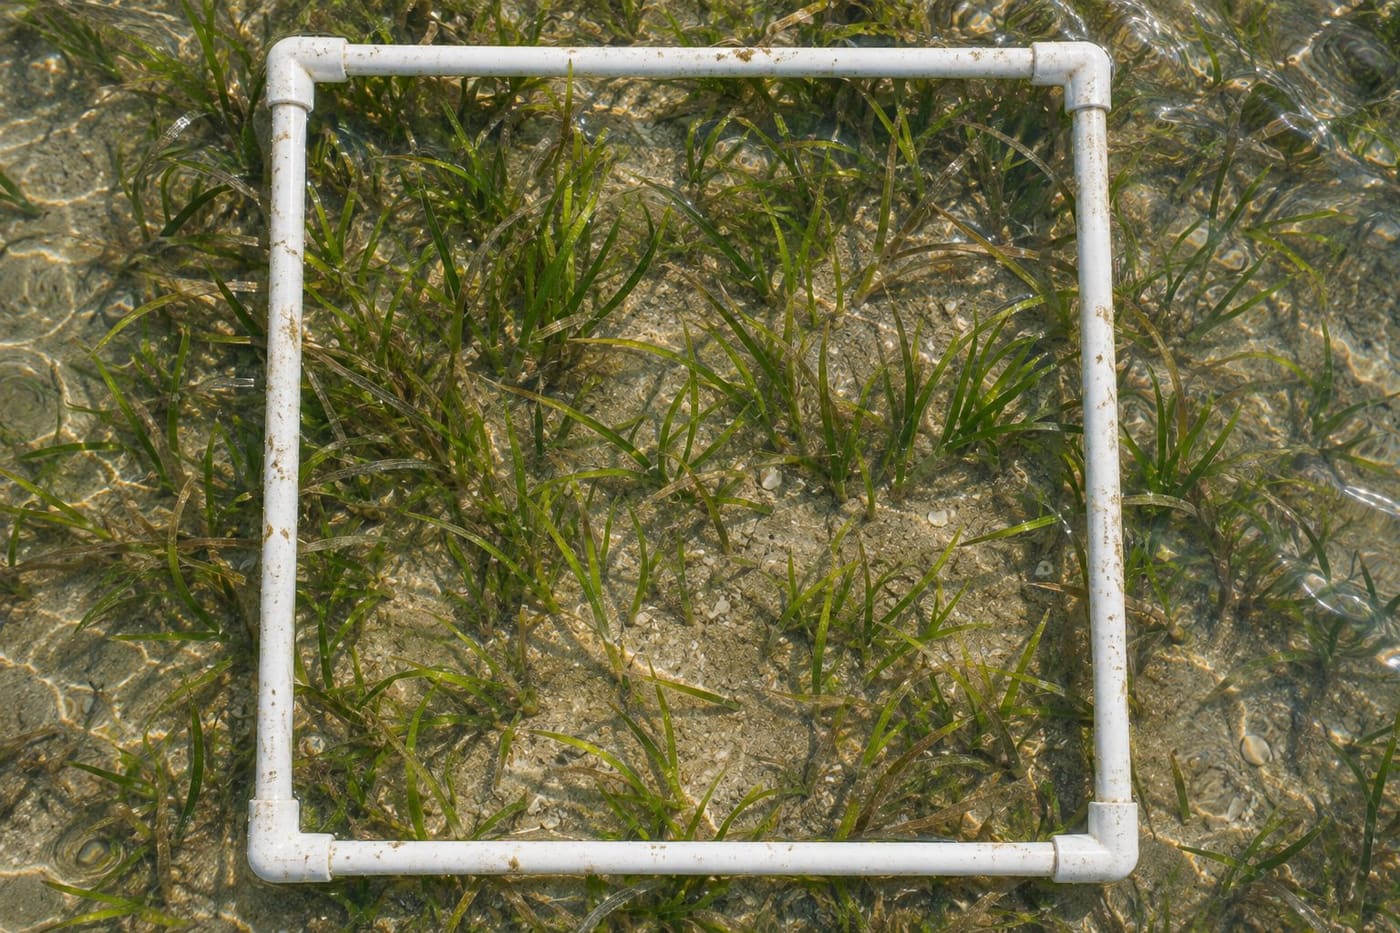
A photograph of a shallow Australian bay can show green ribbons of seagrass between pale patches of sand. A second photograph may look greener. Did the meadow gain cover, or did the photographer stand over a thicker patch? The answer depends on how the images were taken and what part of the meadow each one represents. A survey makes those choices explicit so that a later visit can repeat them.
Seagrass-Watch describes a method that uses fixed lines and regularly spaced sample frames. The design makes it possible to return to the same part of a meadow and look for change there. Reading the results takes another step. You need to distinguish what was measured inside a frame, what the sampling design says about the site, and what would require a different survey. Those distinctions matter when you see a report that says cover rose or fell.
Begin with the boundary of the question
Imagine a community group that wants to know whether a familiar patch of meadow looks different from a year ago. Its question is about a particular place and time. A regional manager asking whether the total area of seagrass in a bay has changed has a broader question. Both can use field observations, but their survey designs must fit different boundaries. A set of repeated frames in the middle of a meadow does not trace the full edge of that meadow.
Cover describes how much of a sampled surface appears occupied by seagrass when viewed from above. Extent describes the area over which the meadow is mapped. A meadow can retain the same outer boundary while the vegetation inside becomes patchier. It can also expand at the edge while cover in an established central patch stays steady. If a report uses “more seagrass,” look for the measurement behind the phrase before interpreting it.
Other observations describe further aspects of a meadow. The Paddock to Reef program design describes indicators including abundance, reproductive effort, species composition and relative meadow extent. It also discusses other measurements and pressures relevant to condition. A good reading starts with the name and unit of the indicator. A cover estimate answers a useful question on its own. A broader judgment about condition needs the context of the program and any companion observations.
Use a fixed line to make the next visit comparable
A transect is a line along which observers place samples. A quadrat is a frame that defines the patch observed at a sampling point. The frame gives everyone a common boundary. If two people look over the same frame, they can compare what they counted as seagrass and what they judged to be exposed substrate. A fixed line helps a team find the same sampling positions when they return.
In one permanent-transect design, Seagrass-Watch describes three parallel 50-metre lines and eleven frames per line, spaced at five-metre intervals including the endpoints. The method records site locations and photographs the frames. This is a particular protocol for suitable monitoring sites. A study in another type of habitat may use a different design. When you read a report, take the design from its methods section rather than borrowing it from a different project.
The intervals matter because the observer isn't deciding where each frame looks most interesting. A stretch of sand is part of the sample if it lies at a designated position. Skipping it would remove evidence about the gaps between plants. Likewise, placing extra frames over particularly dense vegetation without recording the change would alter what the numbers represent. Repeated sampling is valuable because the unremarkable points come back into view too.
A photo helps the next reader understand how the frame was interpreted. Seagrass-Watch recommends photographing each frame with an identifier and aiming for a view close to vertical. Glare, a shadow or an oblique angle can make the same vegetation harder to assess. A good record associates the image with the site, line, point and visit. An image that looks clear but has lost its identifying label is harder to use as evidence of change at that location.
Read a cover estimate and a species estimate separately
Picture a square frame on sand with thin seagrass leaves spreading across one corner and a denser patch on the opposite side. The observer estimates the proportion of the area within the frame covered by seagrass as seen from above. Reference images can help observers calibrate estimates. If two people disagree, checking the photograph against the reference material can reveal whether they counted a gap or interpreted an overlapping clump differently.
A species composition estimate may use a different denominator. In a protocol that expresses composition as a share of the seagrass present, the contributions of the species sum to 100 percent even if the plants cover only part of the frame. For a fictional example, suppose total seagrass cover is 40 percent. Species A makes up three quarters of that cover and Species B the remaining quarter. Their shares of seagrass cover are 75 and 25 percent. Under that convention, the corresponding shares of the whole frame are 30 and 10 percent. Read the column label to see which denominator a survey uses.
A mean can summarise several frames, but it can also conceal the pattern among them. Suppose three fictional points have cover estimates of 10, 40 and 70 percent. Their simple mean is 40 percent. On a later visit the same points are estimated at 20, 40 and 60 percent, which also average 40 percent. The mean held steady while the low point increased and the high point decreased. This small exercise illustrates why a plot of matched points or lines can reveal details hidden by one site average.
Treat zero and missing as separate results. If a frame was observed and contained no seagrass, the observation is zero cover. If a frame could not be observed or identified, it is missing. Replacing missing observations with zeros makes the numbers look complete and can imply a loss that the team did not observe. A report should explain how it handled missing frames, especially when comparing visits with different numbers of observations.
Check what could explain a difference between visits
Put the dates, sample positions and methods side by side. The cleanest comparison uses the same positions and measurement conventions. Even then, a seasonal difference can affect what is visible. A change between two observations answers a question about those observations. To examine a longer trend, look for a series of visits and ask whether equivalent times of year tell a consistent story.
For an illustrative example, suppose a site average moves from 30 to 45 percent. That is a rise of 15 percentage points. It is also a 50 percent increase relative to the starting value, but the percentage-point wording keeps the two cover estimates visible. Before reporting the rise, check whether both averages used comparable samples. If several hard-to-reach points were missing on the second visit, a matched comparison of the positions observed on both visits might tell a different story.
Also check whether the way the estimates were made changed. A team may have adopted a new camera, revised its species guide or changed the way it distinguishes vegetation from glare. Those details do not automatically invalidate a result. They tell readers which changes in the record could affect the comparison. A report that explains its calibration and retains photos makes those questions easier to investigate.
Environmental observations can help interpret a pattern. A survey might record water depth at a frame, sediment appearance or other visible features under its own protocol. Broader monitoring can add measurements that a photograph cannot supply. If low cover follows a period of unusual conditions, that timing can inform a hypothesis. To claim a specific cause, look for supporting observations and a design that can separate it from plausible alternatives. A pair of survey dates alone seldom does that work.
Keep a local result local
Seagrass-Watch's Mackay-Whitsunday reporting describes multiple sites and habitats, including coastal flats in southern Pioneer Bay and seagrass in Catseye Bay. A site name is part of the evidence. Two bays can have different species and physical settings. If a report gives results for one site, retain that site name when explaining what was seen. Extending the result to a wider bay or coast requires a basis in the sampling design or additional mapping.
Ask whether the report is showing a representative selection across habitats or a deliberately chosen site watched repeatedly. Both approaches can produce useful observations. Repeated measurements at a fixed location can show what changed there. A wider design can answer questions about the distribution of changes if it covers the areas to which the report generalises. Some surveys combine approaches, giving readers both a view of individual locations and a broader map.
A repeated frame survey can help a team decide where to look next. For example, declining estimates along one line and steady estimates along two others could prompt a closer inspection of the affected section. Mapping may reveal whether the pattern extends beyond the lines. Additional field records may help assess why it happened. The first survey is valuable because it identifies a pattern at a defined scale, which gives the follow-up a clearer question.
Distinguish habitat observations from carbon accounting too. The Australian government's blue carbon guide discusses measuring benefits such as carbon storage, biodiversity and other services. A photograph or cover percentage tells you about the visible plants within a frame. It does not by itself report the amount of carbon stored in the sediment or how much storage changed after a project. Look for an explicit carbon measurement or accounting method if the claim uses a carbon unit.
Take a survey result apart before repeating it
Look for a count of the observations that sit behind the figure. Consider two fictional sites that both report 40 percent mean cover. One has complete photographs for three lines. The other has usable photographs for only one line because visibility deteriorated during the visit. The identical means are easy to put beside each other, but the second number describes a narrower set of observations. Keeping the observation counts beside the averages helps a reader decide which comparison the evidence can sustain. It also helps a later team choose which part of the site needs another visit.
Start with the place and time. Write down the meadow, site, survey dates and which positions were revisited. Then write down the indicator. If it is cover, identify whether the result is a frame estimate, an average across lines or something aggregated across several sites. Check the treatment of any missing visits and look for photos, field notes or a methods description that would let another reader follow the comparison.
A short statement can capture the result and its scope. For example, a fictional monitoring note might say that mean cover at the matched fixed points rose from 30 to 45 percent between two specified visits, with two points omitted from both means because the second visit could not assess them. That statement gives the next reader the size of the change, the sampling boundary and the reason for excluding data. If a separate map was also made, describe its result separately and explain how it relates to the sampled points.
The same habit of keeping method and place attached to a number applies in other habitats. The Irish raised bog monitoring guide follows that logic for water observations, where the unit and sampling method are different. For seagrass, the most useful question to bring to a striking image or a new figure is simple: could someone go back to the same place and make a comparable observation? A survey that lets them do so gives you something stronger than two photographs that happen to look different.
Sources consulted 7 November 2026
- Seagrass-Watch permanent transect monitoring methods
- Seagrass-Watch Mackay-Whitsunday site descriptions
- Paddock to Reef program design and seagrass condition monitoring
- Australian government guide to measuring benefits of blue carbon restoration