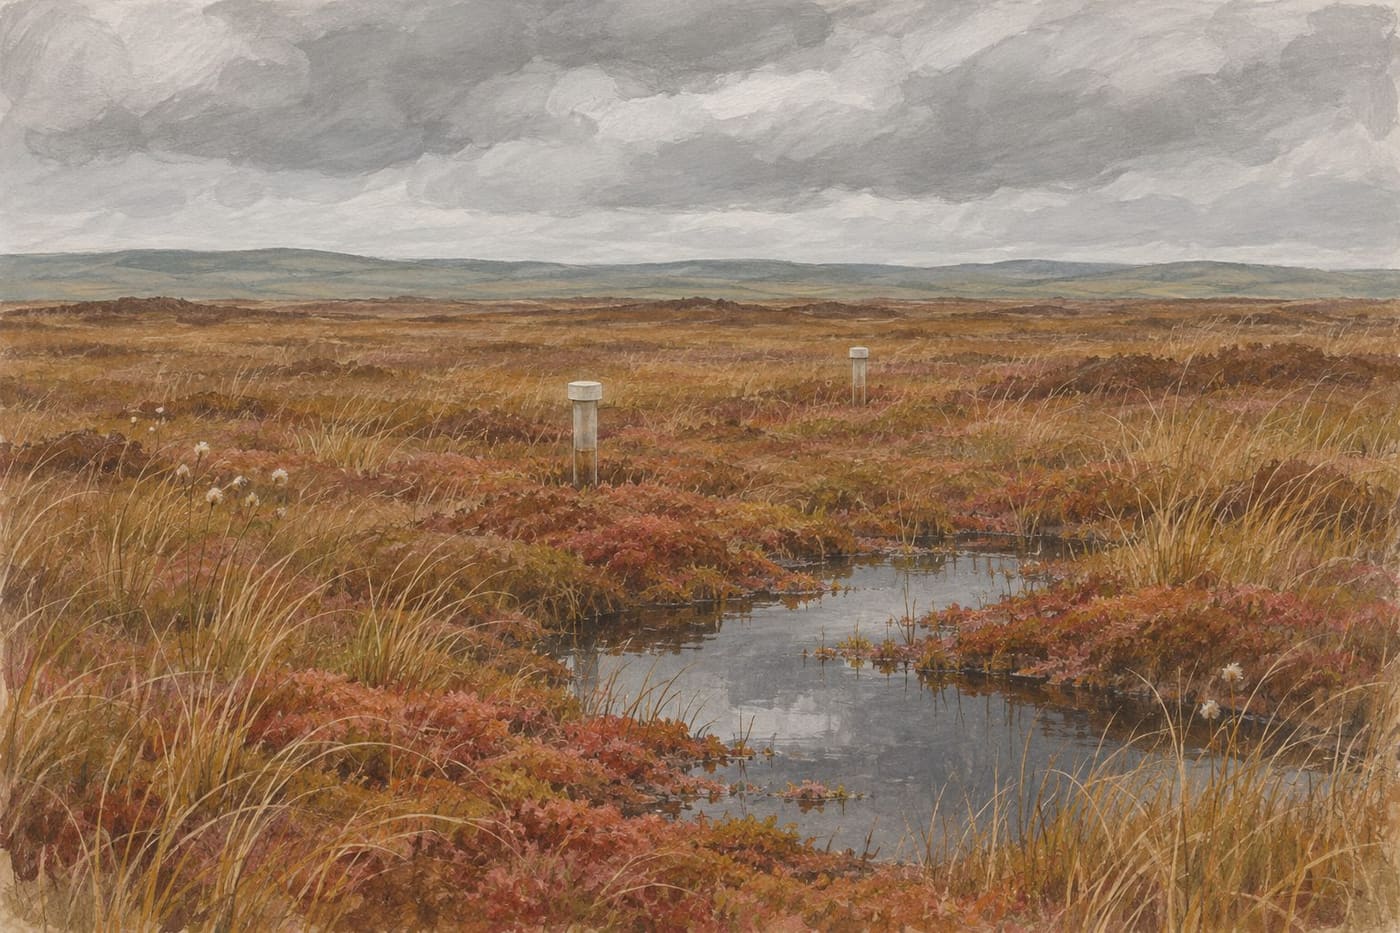
Two photographs show the same stretch of bog. In the first, the peat beside a drain looks dry. In the second, water glints behind a barrier. The photographs tell you that something changed in the view. To understand what happened in the peat around it, you need to know where water levels were measured, how they were measured and what the weather was doing at the time.
That is a useful way into Irish raised bog restoration. Blocking a drain can be part of restoring wet conditions, but the response can vary across a site. Measurements near a drain, at a bog margin and on the interior can tell different parts of the story. This guide follows an original fictional monitoring example. It uses Irish research and conservation guidance to show which conclusions fit the evidence and which ones require more information.
Start with the place and the question
A raised bog is a peatland whose growing peat surface can stand above the land around it. The shape and the ways water moves through and around that landscape matter to restoration. A drain can carry water out along a visible channel. The surrounding peat and the ground below it are also part of the system. An assessment that begins at one drain has to account for how that drain relates to the rest of the site.
The Irish Environmental Protection Agency’s Research Report 342 on degraded raised bogs describes work at Clara Bog in County Offaly and Abbeyleix Bog in County Laois. The researchers found that drainage involving underlying groundwater can matter in some settings, including where peat lies over permeable material. That finding gives a reason to ask how the study area was defined and whether the monitoring network covers the relevant margins. It does not make every Irish bog respond in the same way.
Write the monitoring question before looking at a graph. “Did water in the blocked drain rise?” is different from “Did the surrounding peat stay wetter through the following dry season?” A project can answer the first question while still collecting evidence for the second. If the question is whether the bog is recovering as habitat, water level is one part of a broader assessment.
Consider a fictional site with a shallow drain crossing one corner. A team wants to know whether work on the drain changes the depth to water in the neighbouring peat. It identifies a point close to the drain and a point farther away. It also keeps records from a comparison location outside the expected area of direct influence. Each location has a purpose. The first is sensitive to a local change. The second tests whether it extends farther. The comparison helps the reader interpret changes shared across the site.
Read depth from the stated reference point
A field note might report that water is 24 centimetres below the peat surface. In another report the data could be plotted as a signed height relative to that surface, which would be minus 24 centimetres. Those numbers can describe the same position. Check the axis label and the definition of zero before saying that a line went up or down.
In the fictional monitoring record, all water levels are reported as positive depths below the local peat surface. A decrease from 24 to 14 centimetres therefore puts water ten centimetres closer to that surface. Another chart might plot a water elevation relative to a surveyed reference. If you want to compare its values with depth below peat, you need to know the local surface elevation as well.
In practice, a team may measure down from the top of a monitoring tube and separately measure how far the tube protrudes above the surface. Imagine water is 32 centimetres below the top of the tube, and the top is 18 centimetres above the surrounding peat. With these fictional measurements and no shift in the setup, the water is 14 centimetres below the surface. Record the reference at each point so someone can reproduce that conversion. If the tube or the reference surface moves, the comparison needs attention before the number is interpreted as a change in water.
Even on the same bog, the reference surface can vary between a low hollow and a raised patch. A shallow reading relative to one surface may coexist with a deeper reading relative to another. That difference can help explain local conditions, provided the report describes where the points sit. A useful site map identifies where readings were taken and how the sampling positions relate to drains, margins and vegetation.
Compare the timing before attributing a change
Suppose the team makes one visit before the work and one visit afterwards. Near the drain the depth below peat goes from 24 to 14 centimetres. At the farther point it goes from 22 to 18 centimetres. The comparison location changes from 21 to 17 centimetres. On the same scale, those are shifts of ten, four and four centimetres toward the surface. They are invented values for a reading exercise.
The first point moved more than the other two in that comparison. That pattern is worth following up, especially if it repeats. The two visits alone do not establish how much of the change came from the work. If it rained between visits, all three sites might respond, and the response to rain can differ from place to place. The comparison location helps reveal a shared pattern. It is not an automatic correction that yields a definitive effect from a single pair of dates.
Next, imagine that the two farther points move away from the surface in a dry period while the near-drain point stays shallow. That observation gives the team a new question. Does this occur in other dry periods, and how far from the drain does it extend? To answer, look for repeated measurements over contrasting conditions. If the dates of field work and rainfall are known, compare those with the rise and fall of the readings. Mark gaps in the record instead of drawing a line that implies water was measured continuously.
The same reading habit applies outside peatlands. In our guide to reading stream temperature, the timing and positions of the measurements help explain why a single value can mislead. For a bog, the detail to carry forward is the relationship between the water level, its local reference surface and the conditions leading up to the observation.
Distinguish the work from the response
The National Parks and Wildlife Service’s best-practice guidance for raised bog restoration discusses how peat dams can reduce water loss through drains and help maintain shallow water levels. The examples describe restoration measures for particular settings. Design choices belong to the people responsible for the site and depend on its conditions. As a reader, look for evidence that the work addressed the source of drainage the project identified.
An installation record can show that a dam was built at a given location. A water-level series can show how the surrounding peat responded there. A survey of plants or habitat can address a different part of recovery. These observations work together, but they use different measurements and may cover different times. Reporting them separately helps you see which part of the restoration story the evidence supports.
Say that the team found standing water behind the fictional barrier after a wet week. At the same visit, only one nearby instrument registered shallow water. The photos and measurements do not have to agree in every corner because they are looking at different places. A sensible follow-up would be to look at where the instrument sits, how its readings changed through the wet week and whether other points show a similar response when rainfall eases.
The NPWS Clara Bog site record identifies several qualifying habitats and links to site-specific documents. It is useful for seeing that one protected site contains different features with different conservation interests. A result from one monitoring point should be located within that wider setting before it is used to describe the whole site.
Keep habitat and carbon conclusions tied to their evidence
The EPA study links water-table behaviour to greenhouse gas processes and describes relationships between water, peat and vegetation at the studied sites. A reading of water depth does not itself measure a greenhouse gas flux. To report a carbon outcome, look for what the study measured or modelled, what period it covered and which parts of the system were included. The water series can help explain the result without standing in for the carbon evidence.
Likewise, wet conditions can be relevant to peat-forming habitat while a habitat assessment asks questions about plants and the area they occupy. A photograph with a patch of moss can help document that patch. A repeated survey with clear boundaries can tell you how the distribution changed. If a project reports habitat recovery, check how the area was defined, what conditions it compared and how much time elapsed between surveys.
As a worked reading exercise, consider a headline saying a bog is recovering because depths were shallower at three points. Separate the statement into the observed result and the interpretation. The observation refers to specific readings. The interpretation concerns a broader place and potentially several processes. Ask whether the report contains repeated water levels, coverage of the affected area and any separate habitat survey. If it contains only the readings, you can still describe them accurately and leave the wider recovery assessment open.
One way to audit a project summary is to underline each measurement and circle each conclusion. Imagine a short report that gives a photograph from March, water depths from April and a vegetation map from the previous summer. The dates might all belong to a legitimate monitoring programme, but each record answers a different question. The photograph documents conditions at its moment. The water depths describe the locations measured in April. The vegetation map is a reference from before those visits. You would need a later comparable vegetation survey to say whether mapped habitat changed.
Also look at the scale of the claimed change. A map of the whole bog with three dots tells you where those dots are. It does not show how water levels behaved between them. If the project combined monitoring and a model, check which parts of the map came from instruments and which came from the model. A clear legend and a description of the assumptions make the two kinds of evidence easier to compare. That is especially useful near boundaries where different drainage processes may operate.
Write a conclusion a second reader can check
Before summarising a monitoring result, write down the site, the dates, the measure, its reference and the locations compared. Next, state the actual change in ordinary words. In the fictional example, the water moved closer to the peat surface at all three monitored points between the two visits, with the largest shift near the drain. That conclusion is easy to check against the example numbers.
Then name the strongest remaining uncertainty. In this case, the comparison spans only two visits, and rainfall and the local response are plausible contributors. A reader could improve the evidence by looking for longer series at each point, reference checks and records that describe how the area responded in other seasons. An early signal can guide the next measurement even when it cannot settle a larger question.
The next time you see a restoration photograph, look at it alongside the site map and the monitoring dates. Find the nearest measurement and ask what the number means relative to the ground around it. If the report makes a claim about a wider area, check what observations connect that area to the point in the picture. That approach turns a striking scene into a question you can follow through the evidence.
Sources consulted 7 November 2026. Irish EPA Research Report 342 and National Parks and Wildlife Service guidance and site documentation inform the explanation. The monitoring layout and numerical readings are original hypothetical examples.